

Austin Real Estate Inventory Report: June 2025 Trends by ZIP Code
Published | Posted by Dan Price
Austin Real Estate Inventory Trends: June 2025 Update Shows Sharp Divergences Across ZIP Codes
As of June 2025, the Austin real estate market is showing strong contrasts across its many ZIP codes, with inventory levels shifting in various directions compared to both June 2024 and the beginning of the year. Team Price Real Estate’s latest data confirms that the market continues to fragment, with some areas heading deeper into buyer’s territory while others hold steady or swing back toward sellers.
Months of Inventory (MOI) is a key indicator that reflects how many months it would take to sell all current listings at the current pace of sales. A lower MOI indicates a seller's market with faster-moving inventory, while higher MOI points to a buyer's market with slower absorption. Team Price uses a clear classification: markets with less than 4.9 months of inventory are considered seller’s markets, those between 5 and 6.9 months are neutral, and any market with 7 months or more is firmly in buyer’s territory.
Looking at the year-over-year (YoY) changes, several Austin ZIP codes saw significant increases in inventory levels, indicating softer market conditions. For instance, ZIP code 78739 (Southwest Austin) rose from just 2.03 months in June 2024 to 3.70 months in June 2025—an 81.7% jump. Similarly, 78736 jumped from 4.10 to 6.92 months, up 69.1%. One of the sharpest YoY increases occurred in ZIP 78751, where inventory climbed from 5.59 to 10.00 months, a 79.0% rise, shifting it clearly into a buyer’s market.
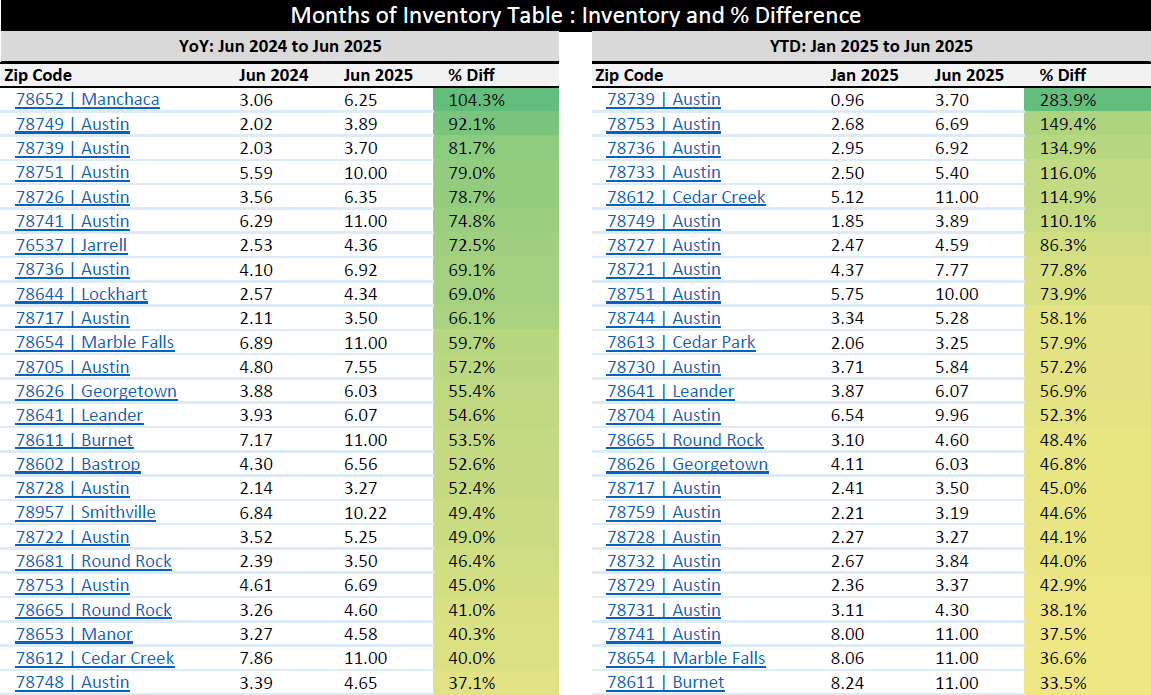
Other areas show even more dramatic shifts when looking at year-to-date (YTD) comparisons from January to June 2025. For example, ZIP 78739 increased from 0.96 months in January to 3.70 months in June—a 283.9% surge in just six months. This reflects a rapidly changing dynamic, even if the area remains in a seller’s or neutral market. ZIP 78736 also more than doubled from 2.95 to 6.92 months over the same period, and 78733 went from 2.50 to 5.40 months, a 116.0% YTD increase, pushing it out of seller's territory.
Among the largest YoY drops, ZIP 78605 in Bertram saw inventory fall from 5.88 to 3.57 months, a 39.2% decrease. However, Bertram’s year-to-date numbers tell a different story. Inventory was 11.00 months in January—now down to 3.57—representing a dramatic 67.5% YTD decline. Other sharp YTD declines include ZIP 78634 (Hutto), dropping from 6.44 to 3.18 months, and 78725 (East Austin), falling from 6.00 to 4.00 months. These shifts suggest strong buyer activity or decreased listings, both of which can reduce available supply.
Some ZIP codes continue to display market stability. For example, ZIP 78669 in Spicewood and 76527 in Florence remain at 11.00 months of inventory across all time points, keeping them solidly in buyer’s market territory. Meanwhile, ZIP 78701, covering downtown Austin, held steady at 11.00 months in both June 2024 and June 2025, suggesting that conditions in the luxury condo market have remained unchanged despite broader market fluctuations.
The neutral market category—between 5 and 6.9 months—now includes several ZIP codes that were previously more volatile. ZIP 78703 rose from 5.74 to 6.90 months YoY, while ZIP 78704 saw a jump from 8.50 to 9.96 months, firmly placing it in a buyer’s market. This west-to-south-central shift reflects a continued buildup of listings not yet being absorbed at 2021 or 2022 levels.
Conversely, parts of Cedar Park and Round Rock remain relatively competitive. ZIP 78613 (Cedar Park) moved from 2.66 to 3.25 months YoY, still a clear seller’s market. Likewise, ZIP 78665 (Round Rock) increased from 3.26 to 4.60 months, up 41.0% YoY, but still below the 4.9-month threshold.
These inventory metrics help clarify local conditions for both buyers and sellers. While some markets, such as ZIPs 78739, 78753, and 78736, are seeing rapid increases in supply, others like 78605, 78634, and 78725 show tightening inventory. For investors and homeowners alike, understanding this variation is essential in gauging negotiation leverage, listing strategy, and the speed at which homes are likely to move.
Overall, the June 2025 data confirms that the Austin real estate market is not moving in a single direction. Instead, localized trends are defining the landscape. Whether an area is shifting toward buyers or still supporting sellers depends heavily on the ZIP code—and more importantly, the pace at which listings are being absorbed into pending contracts.
FAQ: Austin Real Estate Inventory and Market Conditions
What is a buyer's market in Austin real estate?
A buyer’s market occurs when Months of Inventory exceed 7.0, indicating that homes are sitting longer and buyers have more negotiating power. As of June 2025, several Austin ZIP codes such as 78701, 78704, and 78751 are firmly in buyer’s territory, each with over 9 to 11 months of inventory. This typically means more price reductions, longer days on market, and a larger selection for buyers to choose from.
What does Months of Inventory mean in real estate?
Months of Inventory refers to how long it would take to sell all current listings if no new listings were added and sales continued at the current pace. It’s a supply-and-demand metric that helps gauge market health. For example, less than 4.9 months is a seller’s market, 5.0 to 6.9 is neutral, and more than 7.0 is a buyer’s market. This benchmark helps buyers, sellers, and investors understand competitiveness in specific neighborhoods.
Which Austin ZIP codes currently have the lowest inventory?
As of June 2025, ZIP codes with the lowest inventory include 78613 (Cedar Park) at 3.25 months, 78681 (Round Rock) at 3.50 months, and 78717 (Austin) at 3.50 months. These areas are still considered strong seller’s markets with fast-moving homes and potentially multiple-offer situations, despite broader softening in the region.
How has the Austin real estate market changed since last year?
Overall, the Austin market has experienced a general increase in inventory, with many ZIP codes seeing 30% to 80% YoY increases. For example, ZIP 78739 rose 81.7% YoY, and 78736 increased 69.1%. At the same time, some areas like Hutto (78634) and Bertram (78605) saw significant inventory drops, pointing to faster absorption or fewer new listings in those regions.
What factors can cause inventory levels to rise or fall in Austin?
Inventory levels can rise due to an increase in listings, a slowdown in buyer demand, or both. Economic uncertainty, higher mortgage rates, and seasonal trends can all affect absorption rates. On the flip side, falling inventory can result from strong buyer demand, limited new construction, or strategic pricing that encourages fast sales. Understanding these drivers by ZIP code can help both buyers and sellers make informed decisions.
Request Info
Have a question about this article or want to learn more?
